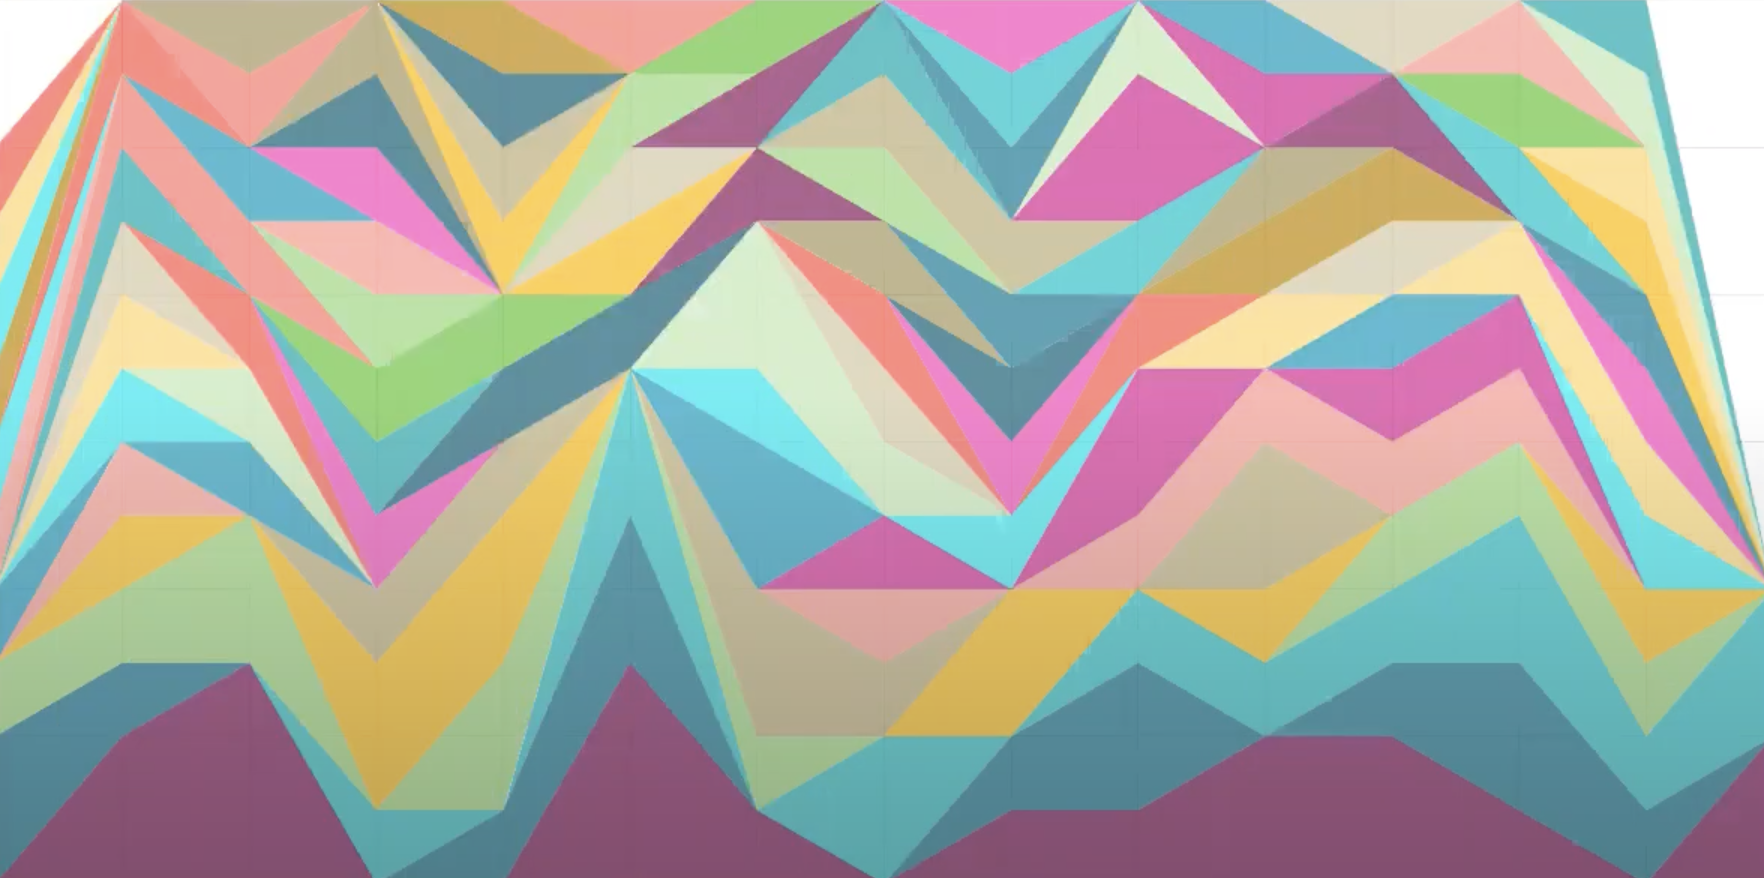
Tool Review: RAWGraphs
Welcome to #FunDataFriday for RAWGraphs
A 3 minute read about a cool data resource.
Today’s #FunDataFriday article is about RAWGraphs, the data viz tool.
What Is It?
RAWGraphs is a data viz tool that facilitates the creation of sophisticated graphing techniques without the code. Data can be loaded via copy and paste, file upload or pointing to a URL which hosts the data. From there, fabulous graphs are just a few clicks away!
Why Is It Awesome?
It’s awesome because it lowers the bar to build impactful data visualizations that lead to insights. On the RAWGraphs website, it states that the tool was created with “the goal of making the visual representation of complex data easy for everyone”.
How To Get Started?
It’s so easy that you can get started by just loading some data and playing around! If you are looking to get started with some data that will fit a variety of the graphs, you can get started with this RAWGraphs tutorial which I previously created. Or, you can explore with their sample data.
Happy graphing!


