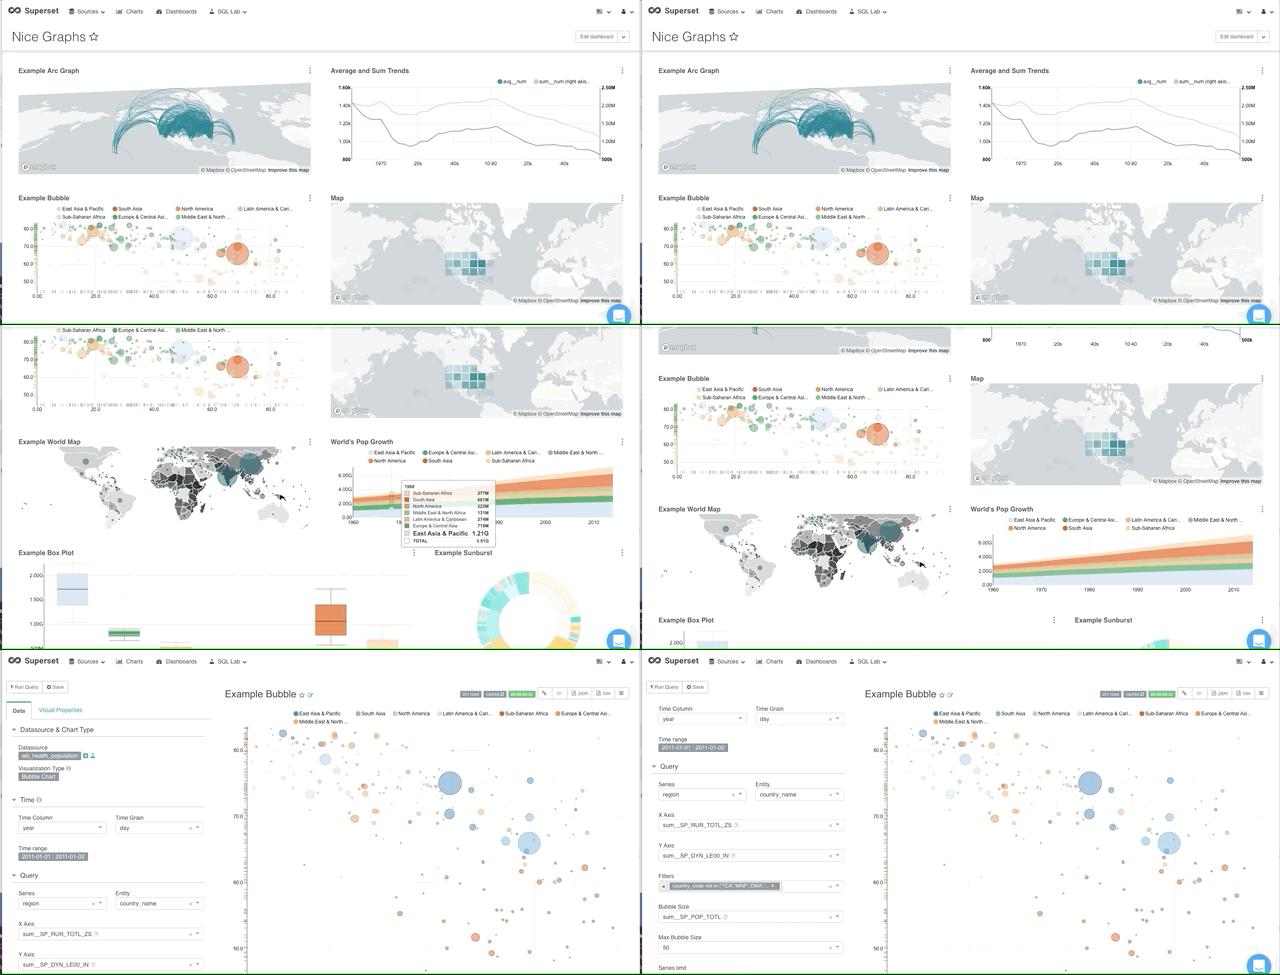
Tool Review: Apache Superset
Welcome to #FunDataFriday for Apache Superset
A 3 minute read about a cool data resource.
Today’s #FunDataFriday article is about the data visualization tool, Apache Superset.
What Is It?
Apache Superset is an open-source data exploration, visualization and dashboarding tool designed with an easy to use, drag and drop style interface.
A gif taken of a demo dashboard on https://demo.superset.cloud. Link to #FunDataFriday dashboard.
Why Is It Awesome?
Superset is great because it’s a very compelling BI style tool and it’s free! As a data viz nut who has not taken the time to learn D3, I also love that most of the graphs are based on highly popular D3 graphing techniques.
For those looking to use it for collaboration, it has a lot of helpful features like authentication, security/permission models and a variety of data source integrations. It does have a semantic layer for data modelling available but it quite limited compared to a number of paid BI tools.
How To Get Started?
Check out a hosted version of Superset here. Or, download and install the tool to explore your own data sources. I followed the Apache Superset installation guide. It was pretty straightforward to set up locally, connect it to my data sources and produce graphs.
Feedback
I am still a newbie with Apache Superset, but I thought that it was cool enough to share with y’all. Please post below if you would like to see a more in-depth tutorial on the tool as I get more familiar.


