
Magazine Review: Wizard Zines
Wizard zines hosts a collection of awesome programming zines and posters by Julia Evans. The zines cover a wide range of technical topics like Linux, networking, debugging, containers, SQL, Git and more!
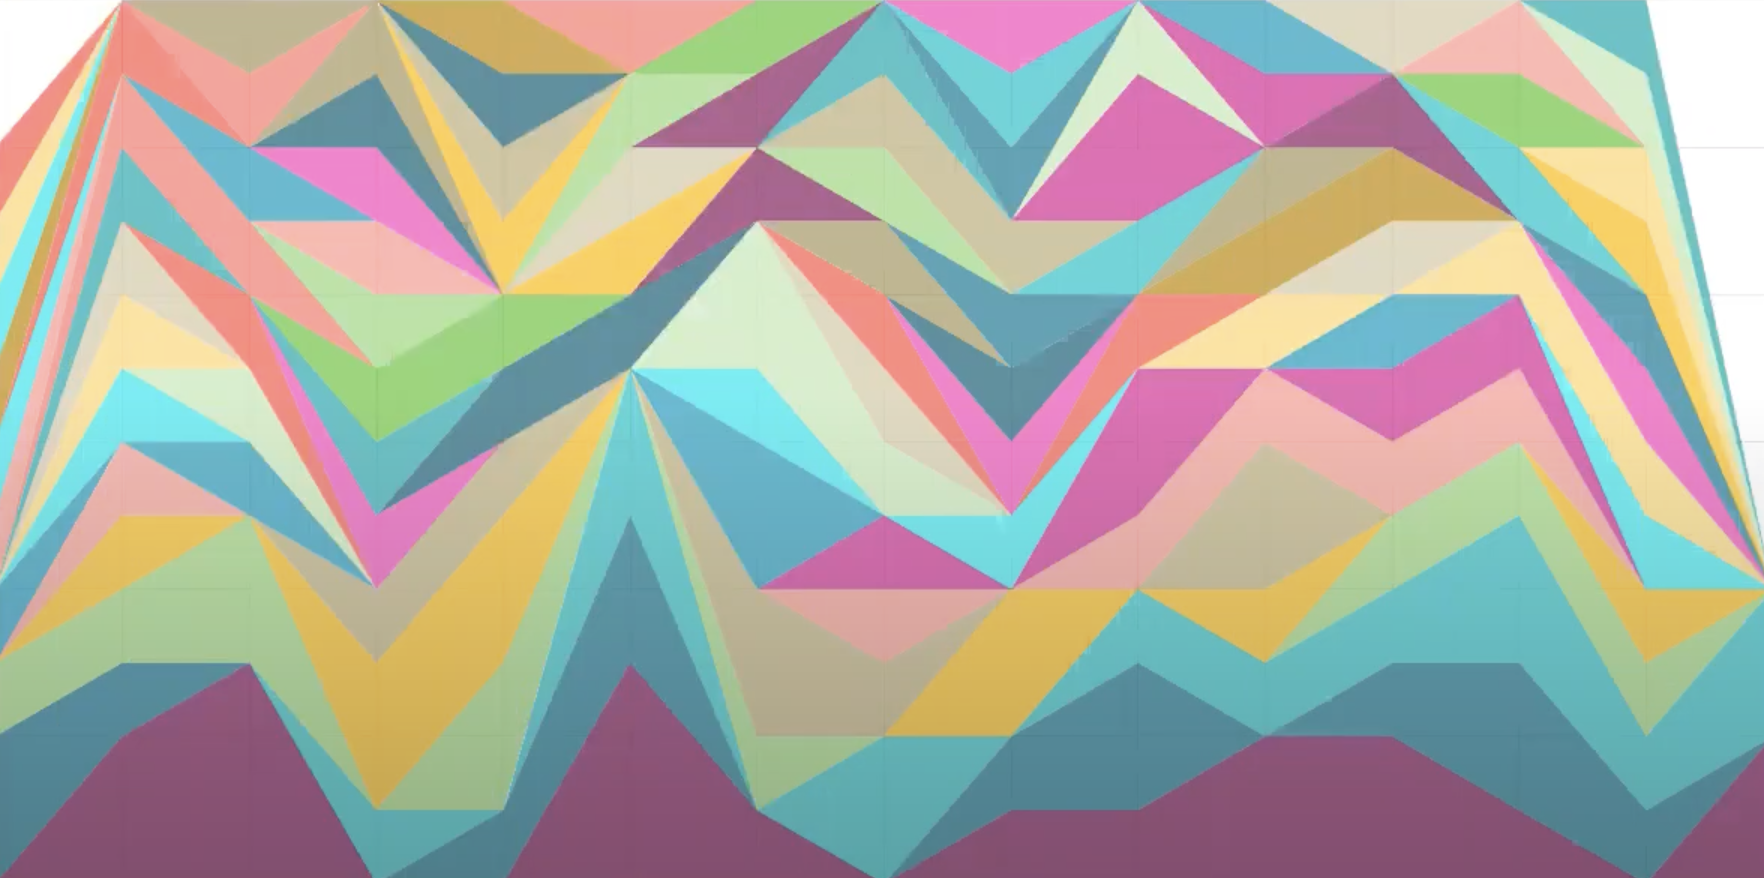
Image credit for SQL statement processing: wizard zines website.

Book Review: The Big Book of R
The big book of R is an open-source web page created by #rstats community member Oscar Baruffa. The page functions as an easy to navigate, one-stop shop for available books on the R programming language.

Tool Review: Data Illustrator
Data Illustrator is an easy and powerful data visualization tool that bridges the gap between traditional BI tools and design tools.

My pelotonR Package Debut!
I just released my first open-source package: pelotonR! The package was created to provide users with sample access to Peloton data through R. Learn more at the website: https://lgellis.github.io/pelotonR/

App Review: TwitterBot
Check out your twitter bot created in R by Thomas Serrano and shared by Bryan D Martin!

Data Science Books for Kids
Sharing some of my favorite data science and data foundation books for young kids!

At Home Data Activities for Young Kids
A week full of very easy data gathering and visualization activities to do with your young kids!

Map Plots Created With R And Ggmap
A tutorial demonstrating how to create geographical maps in R using ggmap. Technologies include: R, Watson Studio and IBM Cloud.

Patchwork R package goes nerd viral
A few weeks ago, my tweet on the R patchwork package went nerd viral. I analyze the tweet performance and possible impact on the patchwork package downloads. I’ll arrange the resulting graphs with patchwork!
As a bonus, I’ll show y’all how I added an image to the patchwork layout by placing it within a ggplot graph and fixing the coordinates to avoid weird scaling issues.

Postgres Conference 2020 - Keynote!
I am very excited to let y’all know that my work bestie, Tiffany Cross, and I will be delivering a keynote talk at the Postgres Conference in March. The title of our talk is: “Data Democratization: Enabling Citizen Data Scientists”.

How to solve a business problem using data
A step by step approach to breaking down your business problem into a less intimidating data problem.

Happy Holidays 2019
Wishing all of my fellow data geeks a very happy holiday season. Celebrating by creating Holiday e-Card themed R graphs.

Magazine Review: Market Cafe Magazine
Market Cafe Mag is a beautiful and thought provoking magazine which showcases beautifully crafted data visualizations and information storytelling.

ATX GIS Day
ATX GIS day is being held in Austin, TX on Nov 13 to celebrate the use of GIS (Geographic Information Systems) data!
Tool Review: Apache Superset
Apache Superset is an open-source data exploration, visualization and dashboarding tool designed with an easy to use, drag and drop style interface.

Package Review: gTrendsR
The gtrendsR package is an R package that can be used to programmatically gather and display Google trend information.

Conference Review: Grace Hopper 2019
Grace Hopper conference is a perfect place for data geekettes to unite!

Analyzing the bachelor franchise ratings with gtrendsR!
Which season of the bachelor really was the most dramatic ever? Analyze the relative popularity of the bachelor franchise seasons as measured by their google search traffic using R, gtrendsR, ggplot2, ggimage and gganimate!

Watson Studio
Watson Studio - An easy and free hosted data science platform for R, Python and a wide range of AI, BI and ETL style activities.

Podcast Review: Data Viz Today
A podcast that opens up your mind up to a wide range of impactful data visualization techniques and considerations!