Nightingale Kids Data Visualization Competition
Recently, it has been HOT in Austin, Texas with highs getting close to 110 degrees Fahrenheit. As a family, we are always looking ways to keep entertained while we stay cool mostly indoors during the day. Recently, while looking for things to do, the first edition of the Nightingale dataviz magazine arrived.

“Dear Nightingale” analogue data creation challenge challenge with with Giorgia Lupi and Stefanie Posavec. Kids data visualization by Julia Krolik.
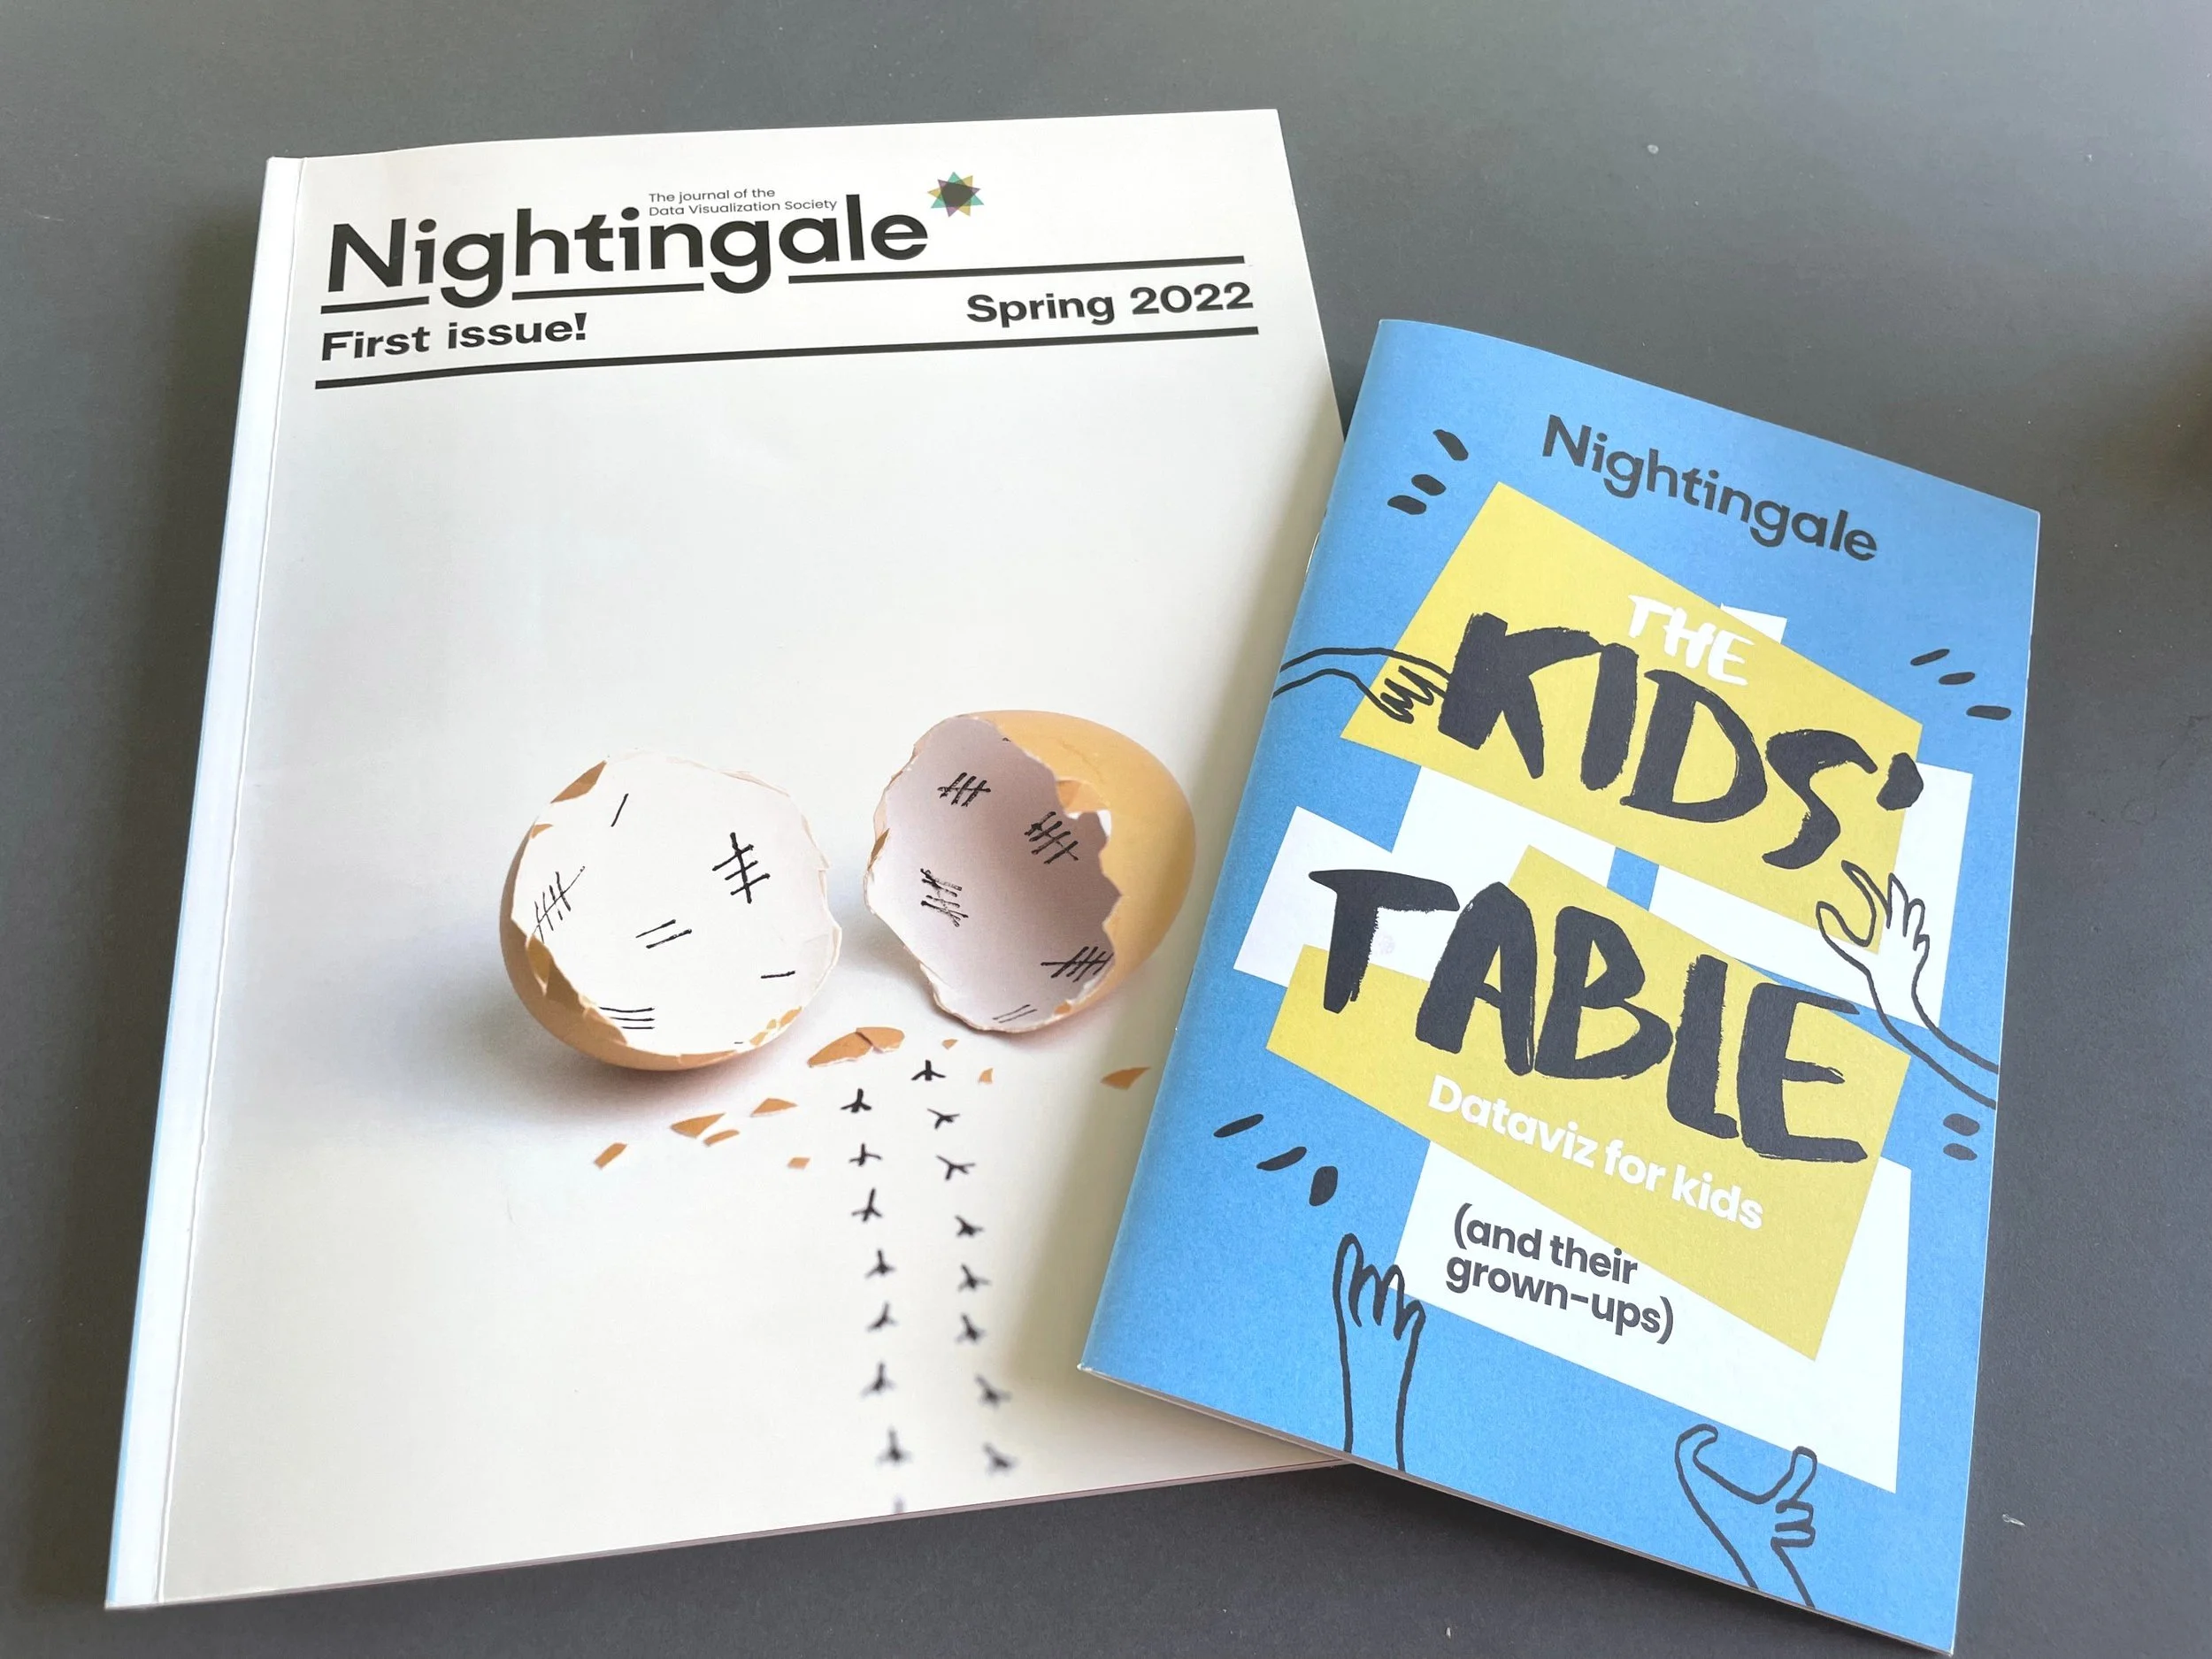
My copy of Nightingale magazine and bonus kids booklet
The magazine shares page after page of beautiful visualizations, educational articles and creative ideas. As an added bonus, it also comes with a Kids mini dataviz magazine. The children’s booklet contains data visualization stories and how-to dataviz exercises.
Nightingale is the journal of the Data Visualization Society (DVS), which has the mission to “foster a community where every member benefits from resources that support growth, refinement, and expansion of data visualization knowledge, regardless of expertise level.”
Keeping that community aspect in mind, the magazines offered a lot of opportunities to participate through their dataviz activities and challenges. I particularly liked the “Dear Nightingale” analogue data creation challenge with Giorgia Lupi and Stefanie Posavec, authors of the dataviz journal “Dear Data”. The idea was to create a non-traditional data visualization (no drawing or computer graphs) using a personal dataset. This article, combined with some of the ideas from the kids data visualization article by Gulrez Khan, inspired me to beat the heat by entering the competition with my kids.

General Waggington and Ava Glitterface competing in the “Race” portion of Ellis puppy olympics.
Finding A Dataset
We decided to create our own “personal dataset” by hosting a puppy olympics challenge with our two dogs; General Waggington and Ava Glitterface. We selected 10 skills to include in our olympic games and constructed the competition so that each dog would be given 3 opportunities per skill to prove their abilities.
Choosing a Visualization
We created a poster scoreboard to track the results. The scoreboard was designed to produce a mirror horizontal bar chart, and the bars were created with puppy stickers. The kids had a great time decorating the board with their own doggie drawings.
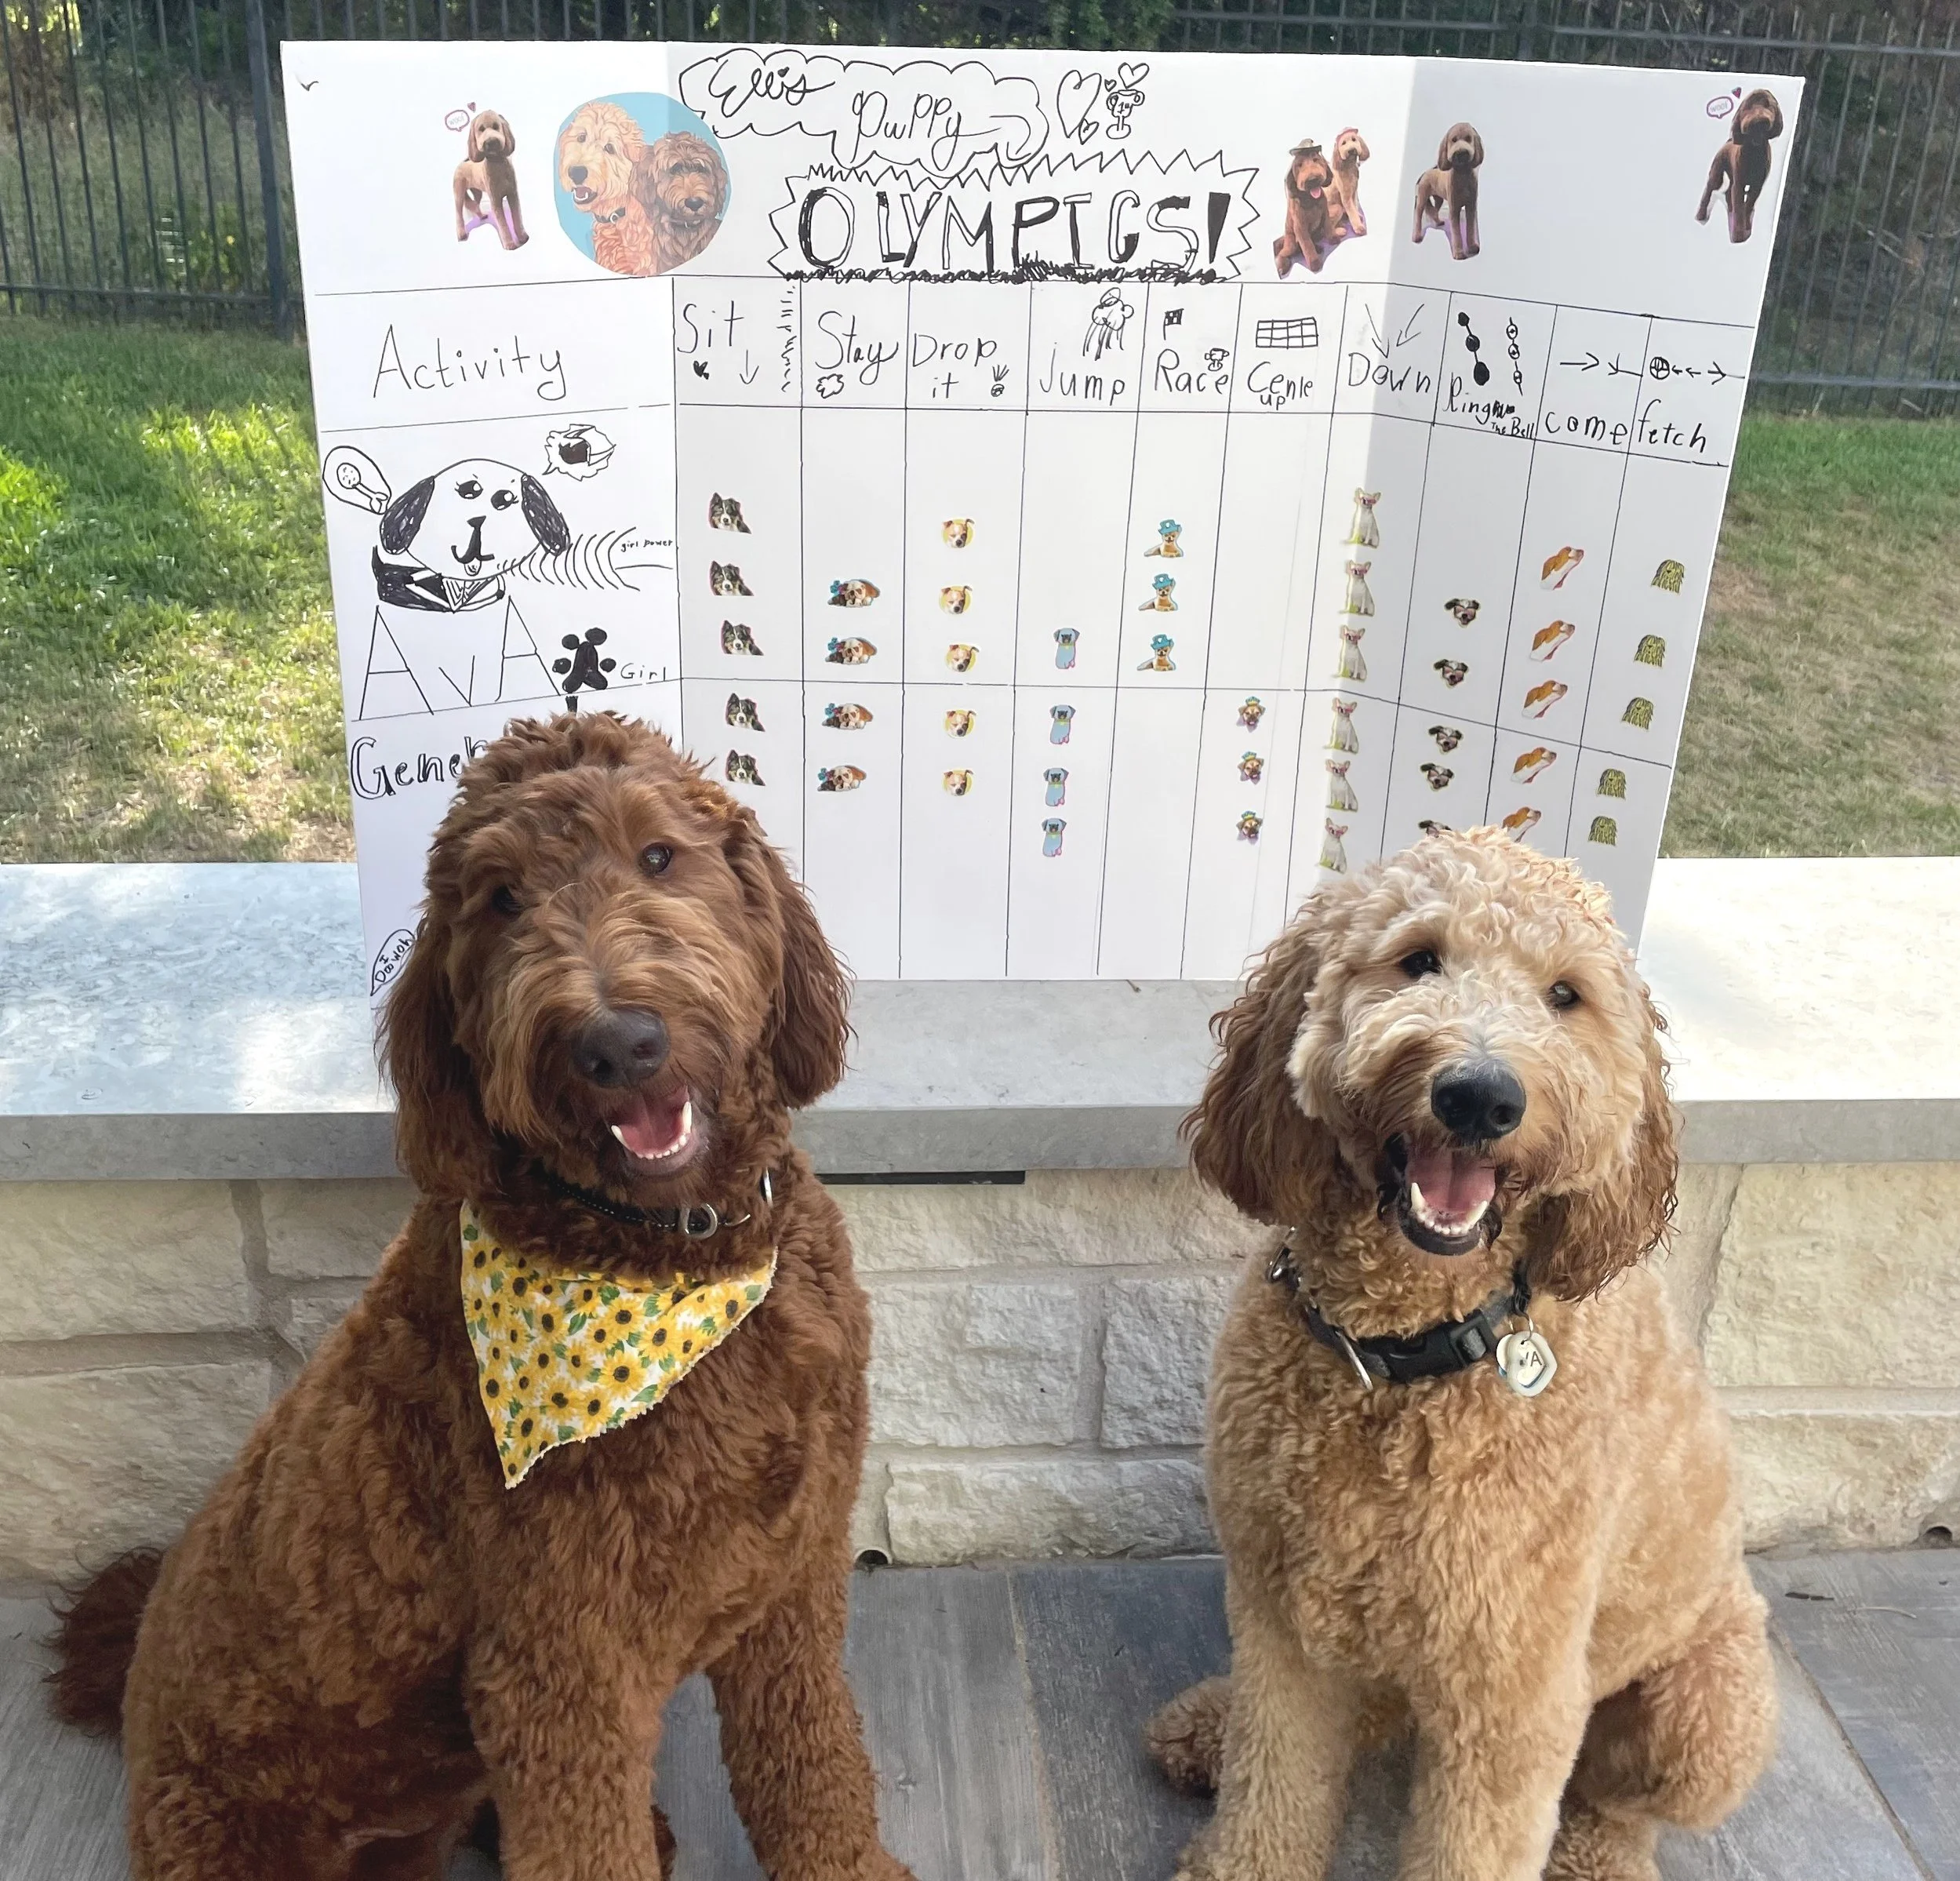
General Waggington and Ava Glitterface standing proudly in front of their results during the Ellis puppy olympics.

Final 3D data visualization made out of clay
Making a 3D Visualization
While we loved our poster scoreboard, the “Dear Nightingale” analog data creation challenge required a 3D dataviz. We held a brainstorming session and ultimately decided to keep the mirrored bar chart, but flip the chart axis to vertical and make the data visualization out of clay.
The clay turned out to be a bit tricky to work with and some of the bars were lumpy, but we had fun making the graph. Overall we are very happy with how the graph turned out, imperfections and all! We submitted our creation to the data competition, and will follow up if the graph gets a feature in the magazine.
Thank You
Thanks for reading about our Ellis puppy olympics data visualization challenge. I hope that it might spark some fun data challenges in your own homes.
Note: This article was also featured in Nightingale is the journal of the Data Visualization Society (DVS) online. The article is posted here.
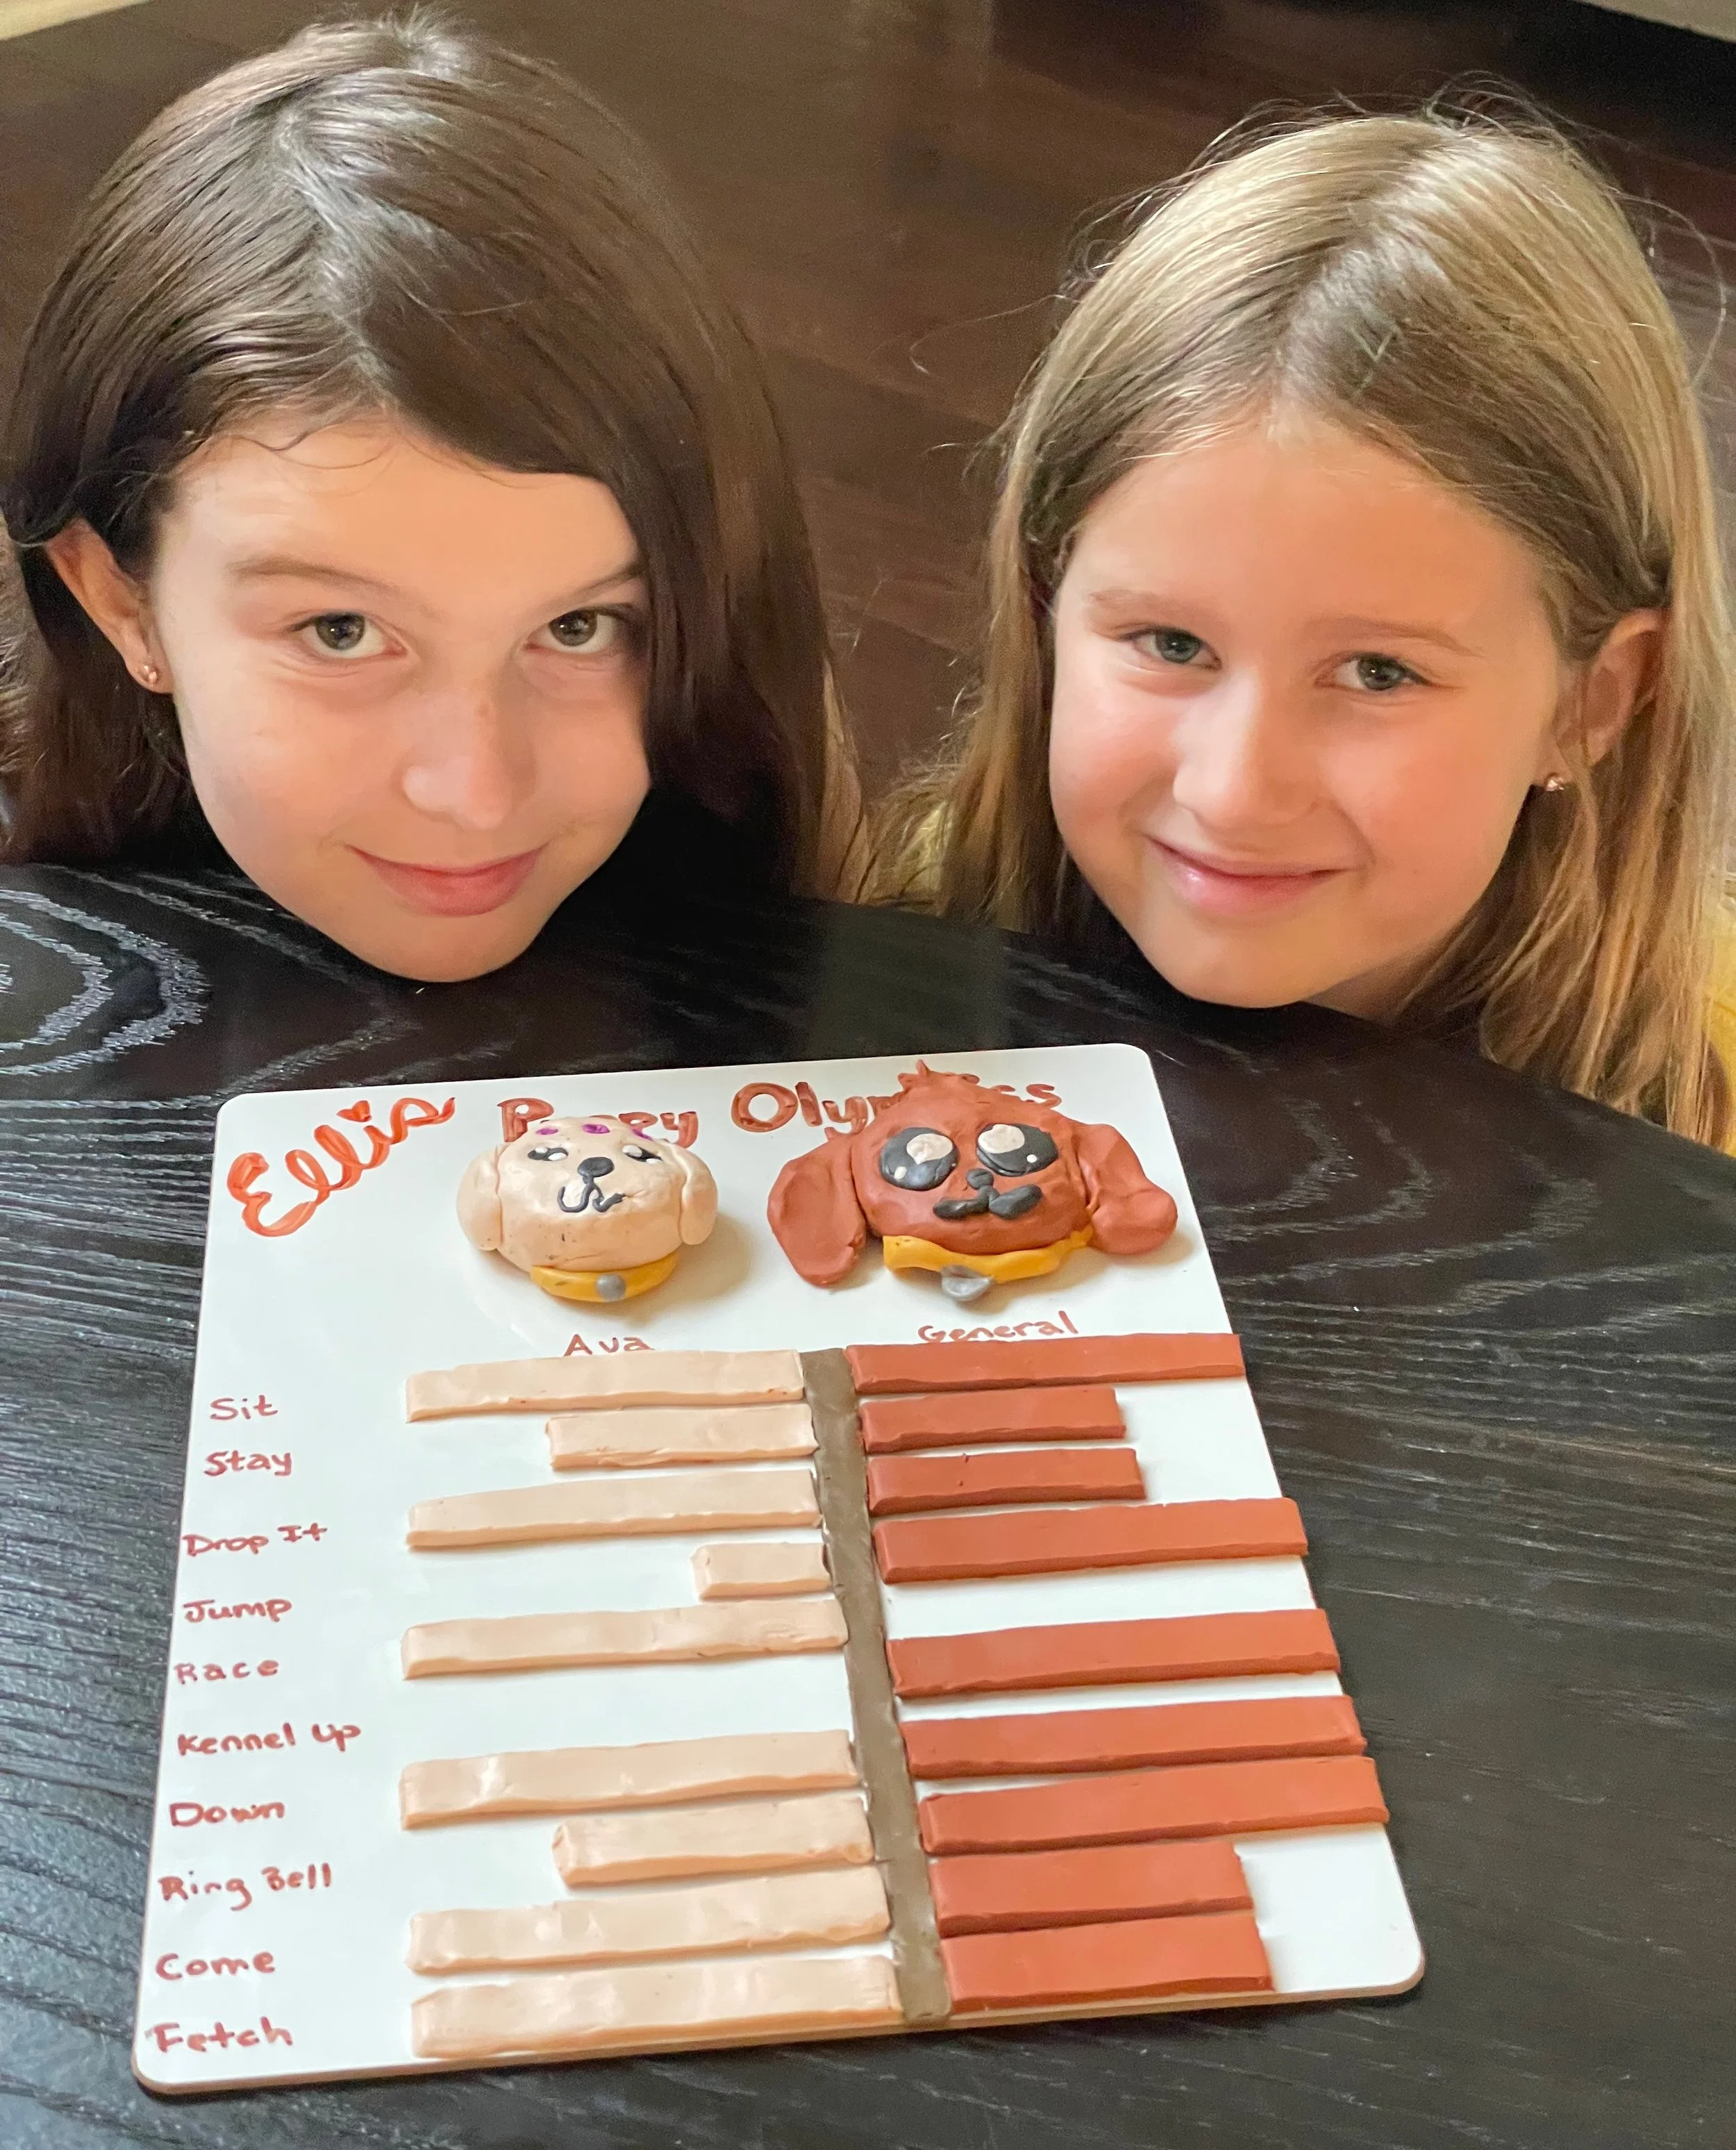
Juliette and Rose proudly showing their data visualization