Explore Your Dataset in R
Exploring your Dataset in R
As person who works with data, one of the most exciting activities is to explore a fresh new dataset. You’re looking to understand what variables you have, how many records the data set contains, how many missing values, what is the variable structure, what are the variable relationships and more. While there is a ton you can do to get up and running, I want to show you a few simple commands to help you get a fast overview of the data set you are working with.
Simple Exploratory Data Analysis (EDA)
Set Up R
In terms of setting up the R working environment, we have a couple of options open to us. We can use something like R Studio for a local analytics on our personal computer. Or we can use a free, hosted, multi-language collaboration environment like Watson Studio. If you'd like to get started with R in IBM Watson Studio, please have a look at the tutorial I wrote.
Download the Data Set
Before we get rolling with the EDA, we want to download our data set. For this example, we are going to use the dataset produced by my recent science, technology, art and math (STEAM) project.
#Load the readr library to bring in the dataset
install.packages("readr")
library(readr)

#Download the data set
df= read_csv('https://raw.githubusercontent.com/lgellis/STEM/master/DATA-ART-1/Data/FinalData.csv', col_names = TRUE)
Now that we have the data set all loaded, and it’s time to run some very simple commands to preview the data set and it’s structure.
R Head Function
To begin, we are going to run the head function, which allows us to see the first 6 rows by default. We are going to override the default and ask to preview the first 10 rows.
head(df, 10)Dplyr Glimpse and Dim Functions
Next, we will run the dim function which displays the dimensions of the table. The output takes the form of row, column.
And then we run the glimpse function from the dplyr package. This will display a vertical preview of the dataset. It allows us to easily preview data type and sample data.
dim(df)

#Displays the type and a preview of all columns as a row so that it's very easy to take in.

install.packages("dplyr")
library(dplyr)
glimpse(df)
R View Function
To interact with the table values even more, you can use the View() function or simply click on the dataframe environment variable in the lower right quadrant of RStudio. I find that it’s nice to use this sometimes because you can scroll and sort easily like you would be able to in Excel.
View(df)R Summary Function
We then run the summary function to show each column, it’s data type and a few other attributes which are especially useful for numeric attributes. We can see that for all the numeric attributes, it also displays min, 1st quartile, median, mean, 3rd quartile and max values.
summary(df)Skimr Skim Function
Next we run the skim function from the skimr package. The skim function is a good addition to the summary function. It displays most of the numerical attributes from summary, but it also displays missing values, more quantile information and an inline histogram for each variable!
install.packages("skimr")
library(skimr)
skim(df)
Visdat Vis_dat function
The Vis_dat() function of the visdat package by Nicholas Tierney is a great way to visualize the data type and missing data within a data frame. This function was suggested by Indrajeet Patil who created the excellent r package ggstatsplot2 which easily plots beautiful data visualizations with inline statistic details. I highly encourage you to check it out.
install.packages("devtools")
library(devtools)
devtools::install_github("ropensci/visdat")
library(visdat)

vis_miss(df)
vis_dat(df)
DataExplorer create_report Function
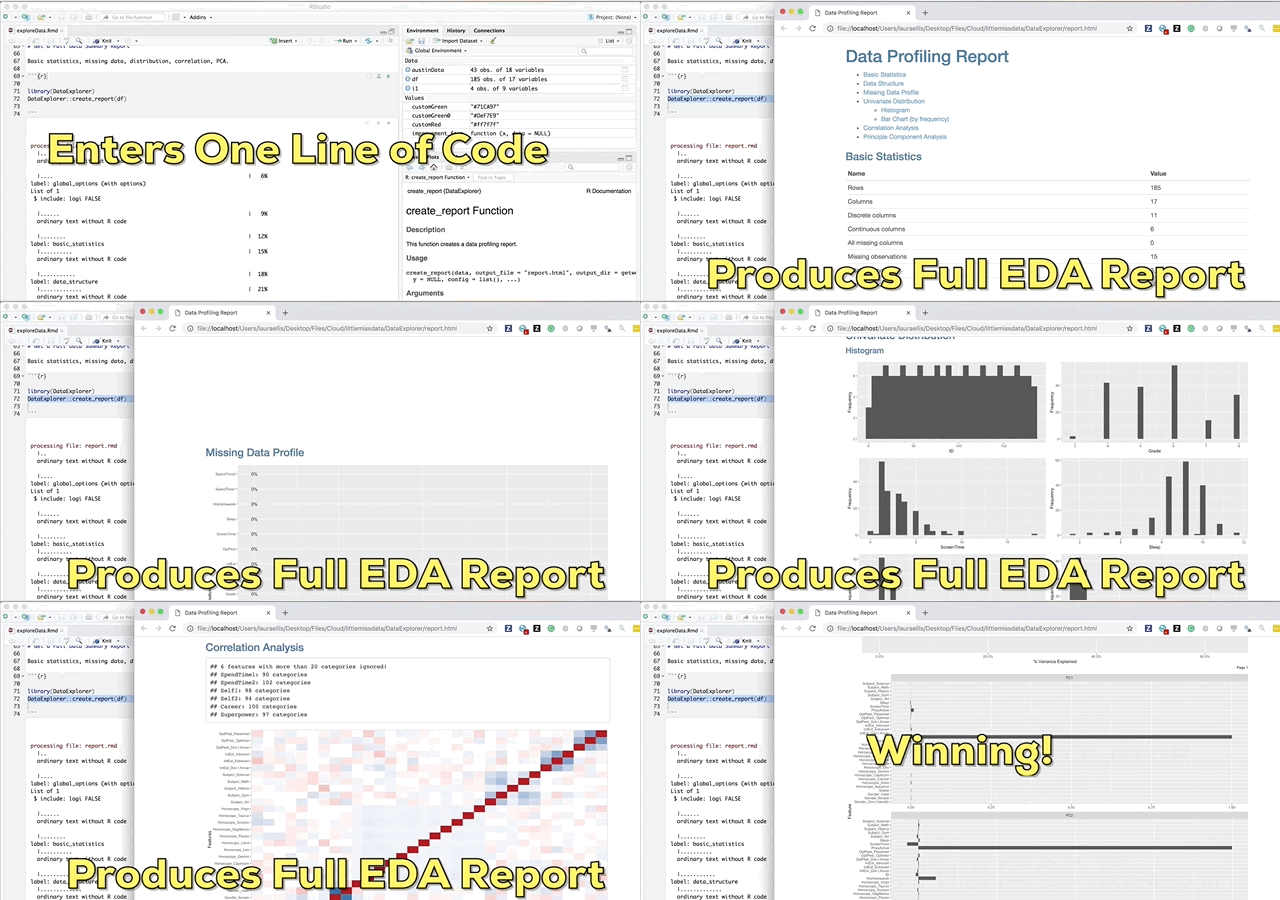
And finally the pièce de résistance, the main attraction and the reason I wrote this blog; the create_report function in the DataExplorer package by Boxuan Cui. This awesome one line function will pull a full data profile of your data frame. It will produce a html file with the basic statistics, structure, missing data, distribution visualizations, correlation matrix and principal component analysis for your data frame! I recently learned about this function in a workshop given by Stephe Locke hosted by R Ladies Austin. This function is a game changer!
install.packages("DataExplorer")
library(DataExplorer)
DataExplorer::create_report(df)
If you experience installation problems: It should be noted that as of Note 2020 this pkg was no longer on CRAN. However, you can still install the pkg from GitHub. From the pkg repository, simply perform the steps below and carry on.
if (!require(devtools)) install.packages("devtools")
devtools::install_github("boxuancui/DataExplorer")
library(DataExplorer)
DataExplorer::create_report(df)Explore further! There are also a ton of extra features in this package that don’t get included by default in the report. Please check out the package introduction here.
More EDA in R
I have recently added a part two to this post which showcases how to use the inspectdf package to quickly and easily explore our data frame or compare across data frames. Please check it out!
Preview of the inspectdf graphical output
Thank You
Thanks for reading along while we explored some simple EDA in R. Please share your thoughts and creations with me on twitter.
Note that the full code is available on my github repo. If you have trouble downloading the file from github, go to the main page of the repo and select "Clone or Download" and then "Download Zip".


